Integration fails before customer calls — not after
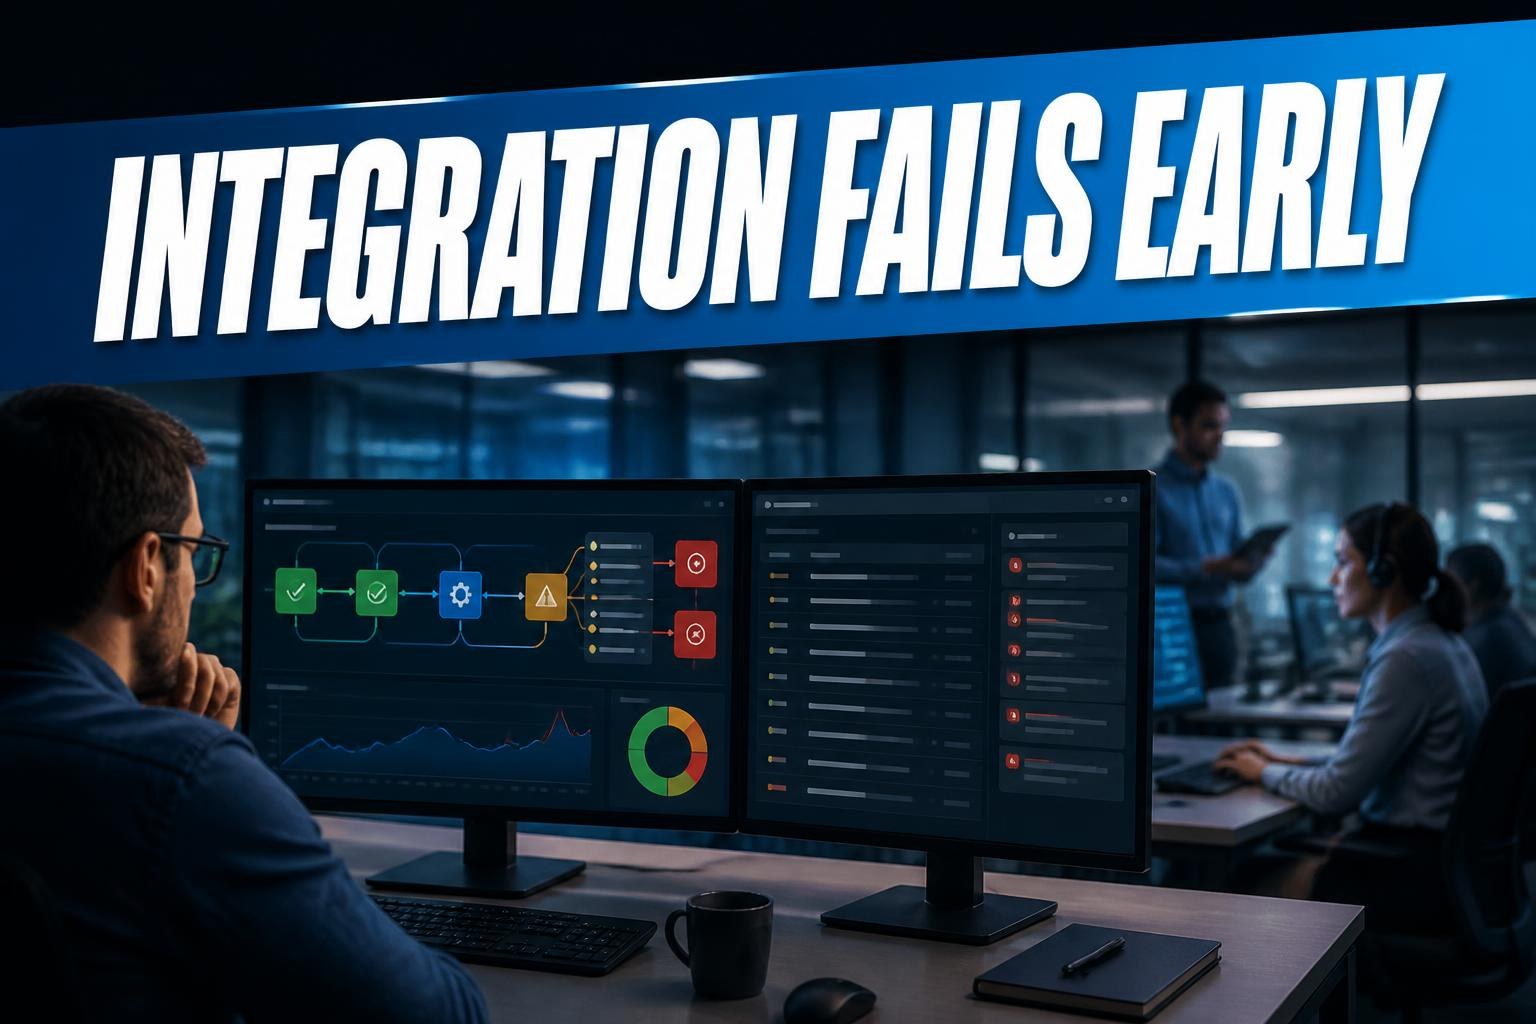
APIs, queues, and connectors monitored with alert, runbook, and health view in one panel.
IT only discovers integration down when customer service calls or closing stalls. Proactive monitoring observes APIs, queues, and connectors continuously — latency, error rate, backlog, and trend. Alert fires with context and runbook before operational impact; exception goes to queue with guided replay. Manager and IT see integration health in one panel — not status spreadsheet requested by email every morning.
What blocks you today
Order stops entering ERP and nobody sees until volume accumulates. Queue grows silently; dead-letter becomes Monday surprise. Each team monitors their piece — fragmented view and late correction.
What changes in practice
- Continuous monitoring of APIs, webhooks, queues, and critical connectors
- Alerts with threshold, trend, and context — not just 'service down'
- Health panel per flow: latency, error, volume, and backlog
- Runbook and guided replay for exception queue and dead-letter
- Integration with alert channel your team already uses — email, Teams, or internal WhatsApp
Business outcome
Incident becomes same-day correction — not weekend project. Operations and IT share same health reading. Customer stops being integration failure sensor.
Where it usually fits
- Companies with critical integrations between ERP, CRM, marketplace, and partners
- Multichannel operations where minutes of delay become oversell or breached SLA
- Lean IT without 24h on-call but flows that can't stop silently
- Businesses with iPaaS or connectors but lacking unified visibility
- Growing groups with new integrations every quarter
How it evolves next
With stable observability, you can evolve to predictive detection, simple auto-remediation, and SLA reported to operations.
- Anomaly detection in volume and latency before static threshold breach
- Auto-remediation of retry and reprocessing on transient failures
- iPaaS layer with native monitoring on every new connector
- Event bus with end-to-end trace from publisher to consumer
- Executive integration SLA dashboard for leadership and operations
Order stops entering ERP and nobody sees until volume accumulates?
Queue grows silently? Contact us — we build the pipeline with clear exceptions and audit trail.